Illustrating Text with Limited-Domain Functions Combined Together
Mon Sep 18 2023Inspired by the fascinating graphs learned from Math lessons, I decided to combine my knowledge of graphs and produce a piece of text written on the Cartesian coordinate system on my graphical calculator.Introduction to The Activity
Inspired by the fascinating graphs learned from Math lessons, I decided to combine my knowledge of graphs and produce a piece of text written on the Cartesian coordinate system on my graphical calculator.
Focus
Addressed Learning Outcomes:
- Identify your own strengths and develop areas for personal growth.
- Demonstrate that challenges have been undertaken, developing new skills in the process.
- Demonstrate how to initiate and plan a CAS experience.
- Show commitment to and perseverance in CAS experiences.
CAS Hours
CAS Stages
Investigation
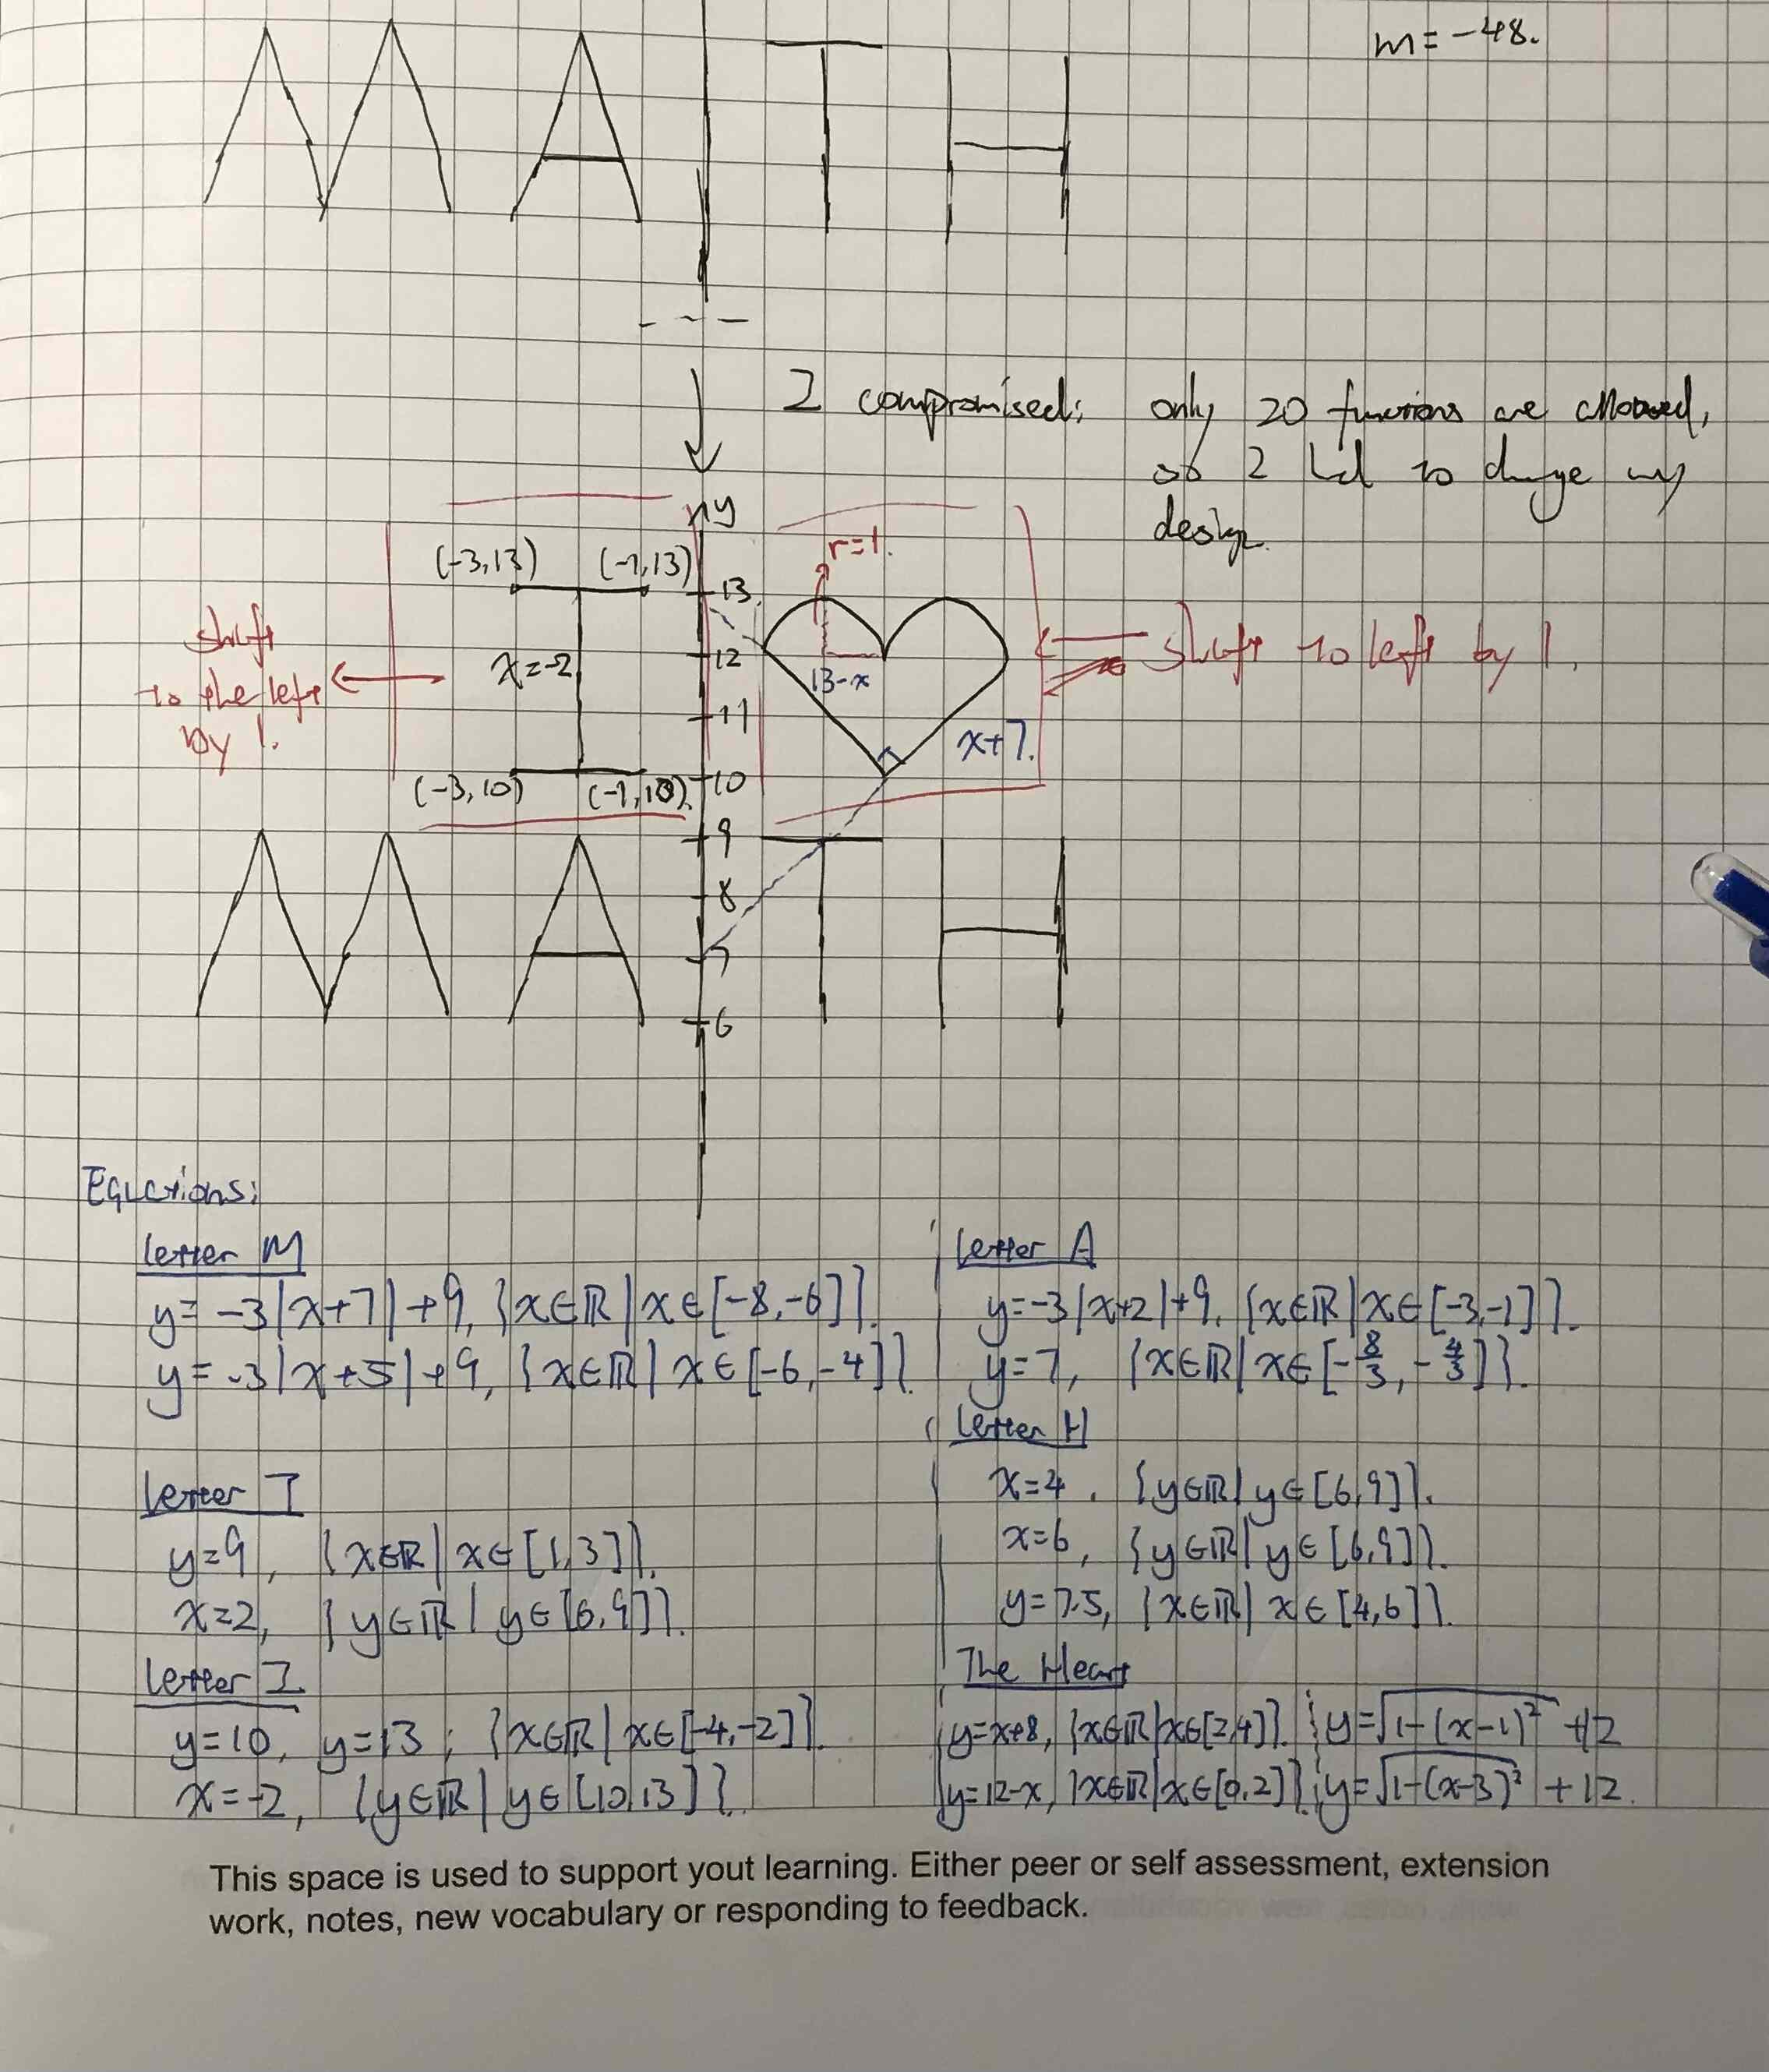
By going through the alphabet and identifying that, for a simpler version, all texts can be represented by grouped pieces of functions with restricted domains and ranges. E.g. the letter A can be regarded as a concave absolute value function with a steep gradient and grouped with a straight horizontal line somewhere in between the two halves of the graph.
Moreover, having to graph functions in a certain interval was something new and that I had to spend time researching.
Preparation
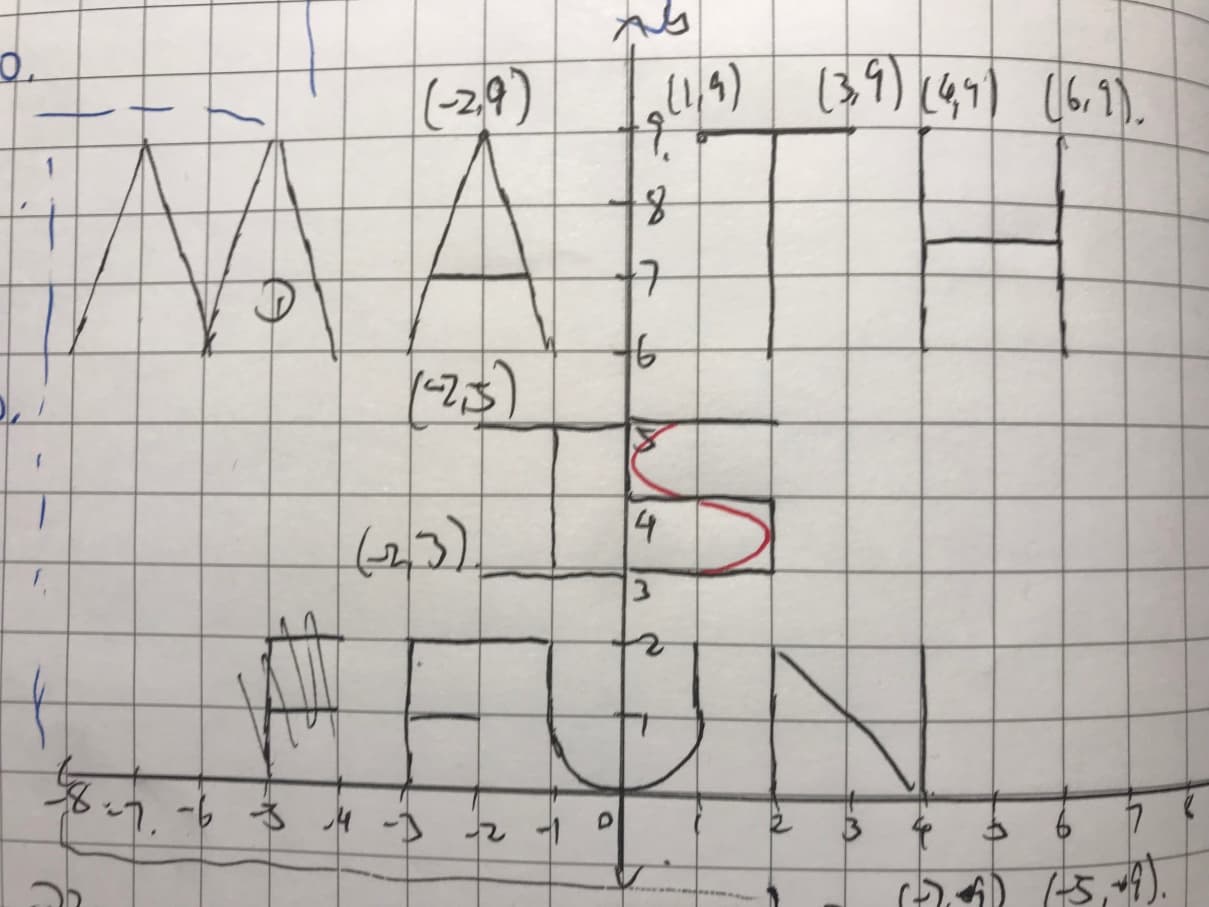
For a quick visual start, I drew a quick sketch of the final graph on a grid paper:
During the action, however, due to the limitations of the calculator that only 20 functions can be entered and graphed at maximum, I had to change te design and end up with the following prototype and required equations:
Action
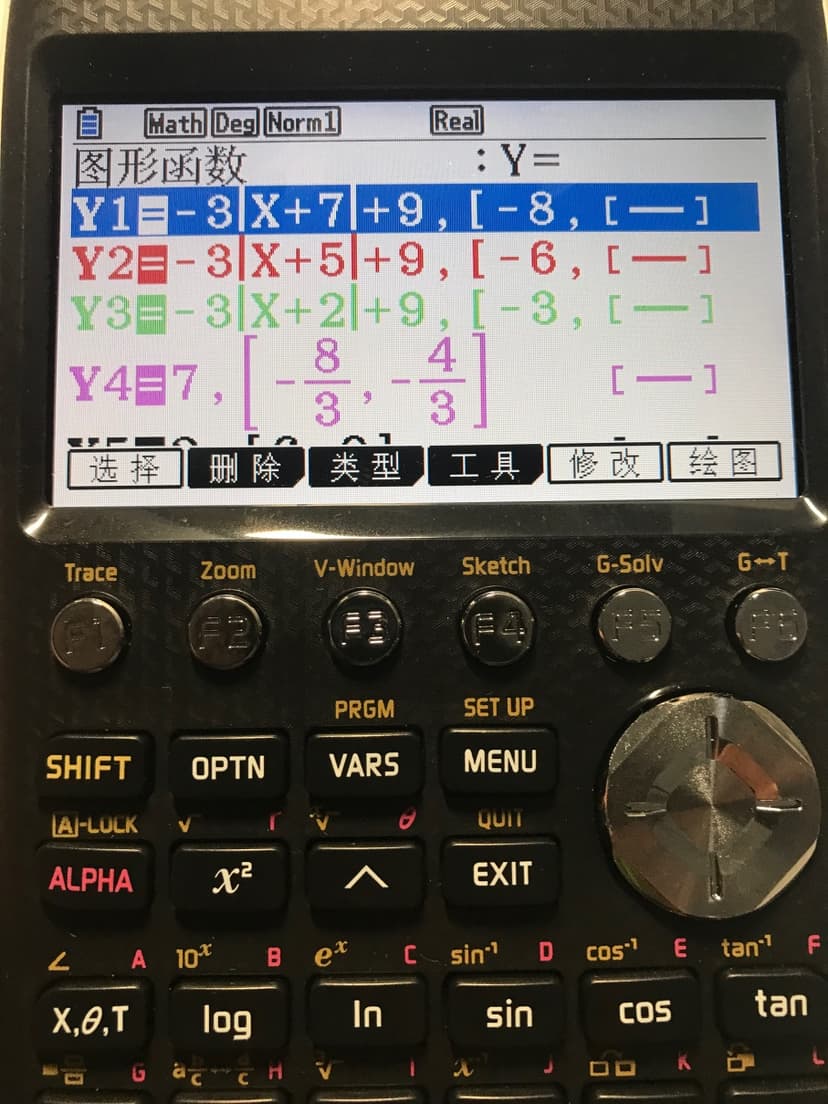
Inputting the functions into the calculator one by one; half way through the initial version:
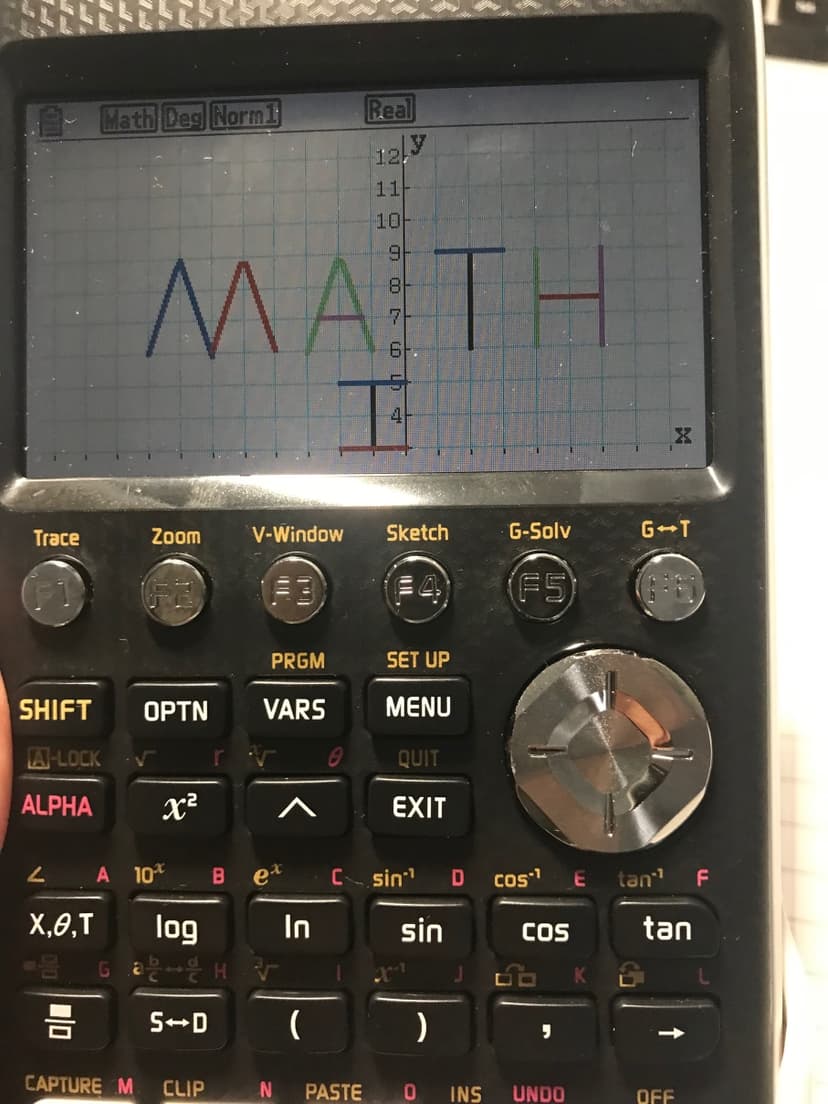
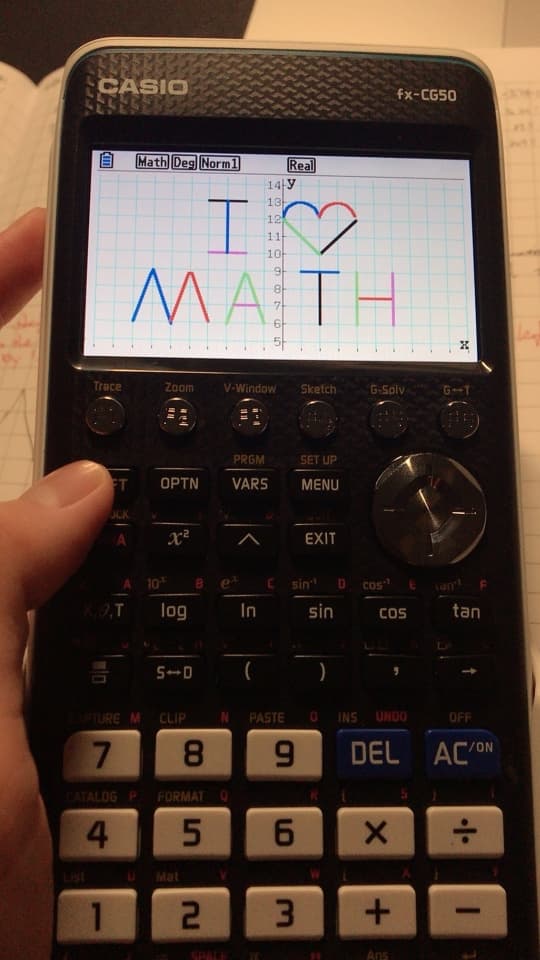
Upon reaching the limit of the graphing function, I implemented my new design and finally ended up with:
Reflections
Producing the required functions one by one will require a lot of work but I personally regard it as an excellent opportunity for me to learn how to take full advantage of the Casio fx-CG50 graphical calculator.
Calculating each piece of graph requires a lot of precise working out, which involves identifying the type of functions required for each piece and substituting correct values of coordinates into the equations to determine the functions individually. It was repetitive but accuracy-demanding.
During the implementation process, I stumbled upon a limitation of the calculator: only up to 20 functions are allowed to be inputted, and so I compromised and altered my design to simplify certain bits with other types of graphs.
It was a long pocess having to design and redesign, implement and modify the graphs and functions. But it was proved to be worth the time and effort as approaching how to graph functions with restricted domains was a target of mine when I first started to utilize the calculator.